Sunday, May 28, 2006
Jumping on the bandwagon
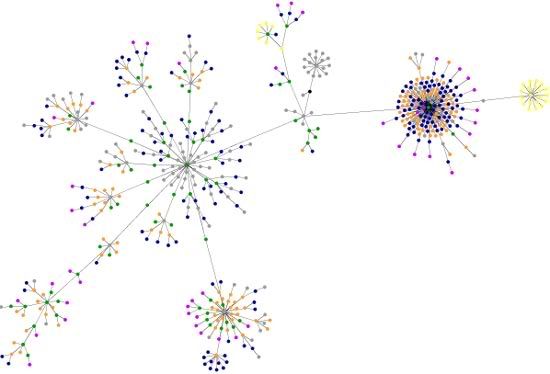
All the cool kids have been playing with this new toy that takes your website html and makes it into a pretty graph. So here is a graphic description of my web authoring style:

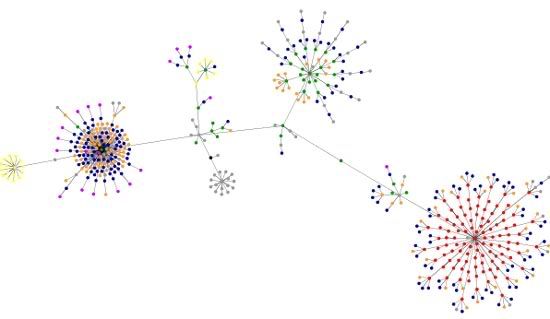
The nice looking globe on the right side there will be my link-tastic side bar (blue dots are links and orange ones are the line breaks that go after them). The rest of the graph just goes to show my completely haphazard html style, lots of odd tags (grey nodes) and very little structure! I was quite proud of the table I made way back when hosted an iteration of the Tangled Bank so I chucked that through the machine too:
Now that's kind of cool. The 'side bar globe' appears again but the bit I really like is the cluster on the right that represents the table. The graph is really cool way of showing how the table is built by using the same basic pattern ( a bunch of table elements, a couple of links and a linebreak) repeated over and over again.
1 Comments:
brtaram


